Turning an old laptop into a live home gym dashboard is an easy and low‑cost way to bring data into your workouts. With a few open‑source tools like Grafana, some simple sensors, and basic configuration, you can see heart rate, workout logs, and timers on a single screen. This guide walks you through the concept step by step so you can stop paying for closed fitness platforms and start owning your training data.
Why build a DIY home gym dashboard
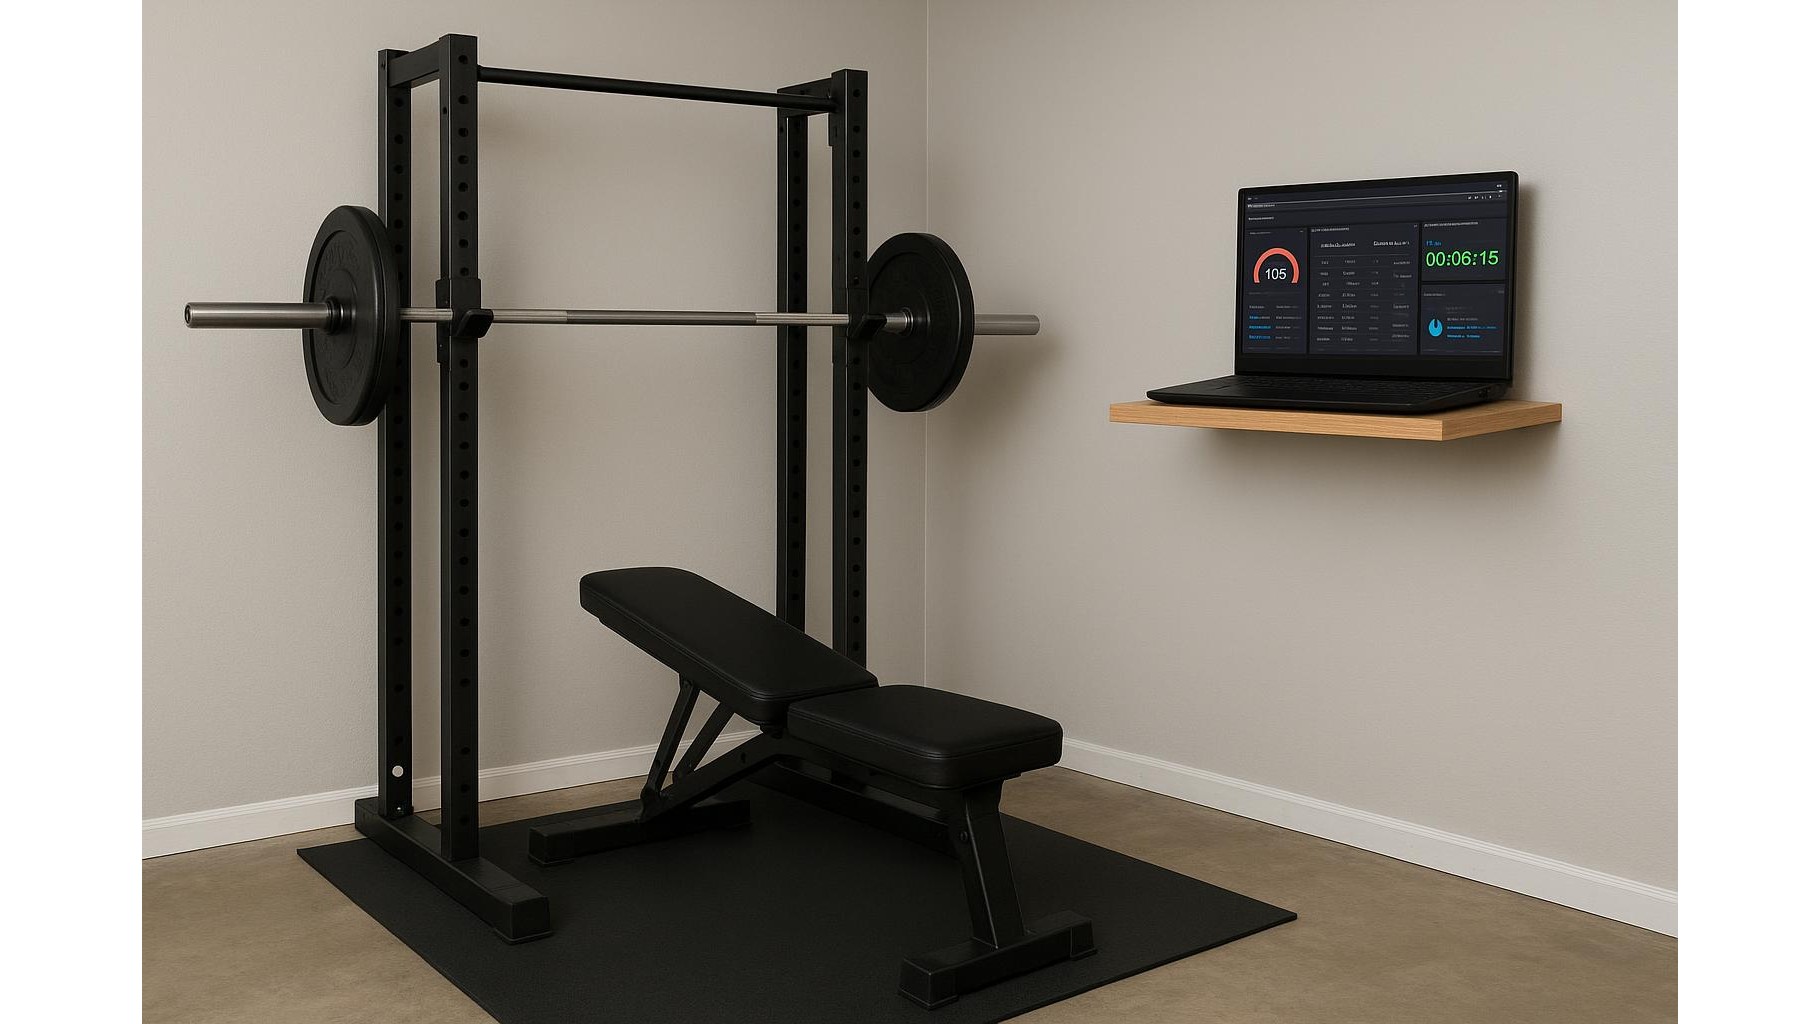
A dedicated home gym dashboard helps you keep workout information visible without juggling multiple apps. Instead of checking your phone for intervals, a smartwatch app for heart rate, and a notebook for training logs, Grafana lets you combine everything into one clean, customisable layout. Using a spare laptop or old PC, you can mount the screen near your rack or cardio machine and run it as a full‑screen display. Because the stack is built on open‑source software, you are free to choose which sensors to integrate, how long to retain data, and how your panels look. It is also a great tech project for anyone who enjoys optimising their home gym setup.
Core components: laptop, data source and Grafana
At the centre of this setup is your old laptop, which will act as both the data collector and the dashboard display. Install a Linux distribution or a lightweight version of Windows to keep things smooth, then add a simple time‑series database such as InfluxDB or Prometheus to store training metrics. On top of that, you install Grafana, a powerful open‑source visualization platform that connects to these data sources and turns them into graphs, gauges and tables. To feed data into the database, you can use scripts that read your heart rate from Bluetooth devices, log sets and reps from a simple form, or even sync exported files from existing fitness apps. The key idea is that all data ends up in your own database, and Grafana becomes your central home gym control panel.
Tracking heart rate and cardio metrics
For many lifters and endurance athletes, heart rate tracking is a priority. You can connect a Bluetooth or ANT+ heart rate strap or armband to the laptop using compatible software that exposes the live reading as a data stream or log file. A lightweight script can then push those values into your time‑series database every few seconds. In Grafana, you create a panel that shows a large digital heart rate readout, a rolling line graph of the last 10–20 minutes, and colour zones that match your training targets. This makes zone 2 cardio, HIIT intervals, or conditioning finishers much easier to manage without checking a wearable. Over time, you can compare sessions, track resting heart rate trends, and correlate cardio work with strength days.
Logging strength workouts and timers
The same dashboard can handle strength training logs and timers. Instead of writing everything in a notebook, you can build a simple web form or spreadsheet that records exercise, sets, reps and load; a script then sends these entries into the database after each session. Grafana can display this as a recent workout table, a graph of volume over weeks, or a PR tracker per lift. For timers, you can log the start and end of intervals or EMOM rounds and show a clear countdown panel on the laptop screen. Having all this on a large display near your rack means you can glance up to see how many seconds are left in a rest, what weight you used last week, and whether you are on track with your current training block.
Designing the perfect home gym screen layout
With the data flowing, the fun part is designing your Grafana dashboard layout. A common approach is to dedicate one row to heart rate and cardio metrics, another to strength logs, and a bottom row to timers and session notes. Use large fonts and high‑contrast colours so the screen is readable from across the room. You can also create multiple dashboards: one for lifting days, one for conditioning, and one for recovery metrics like sleep duration or bodyweight. Because Grafana supports variables and filters, you can switch the view to a specific program cycle or week of training with a single click. Run the laptop in full‑screen browser mode, disable sleep settings, and you now have a permanent home gym display that feels like a commercial studio setup.
Expanding your open‑source fitness ecosystem
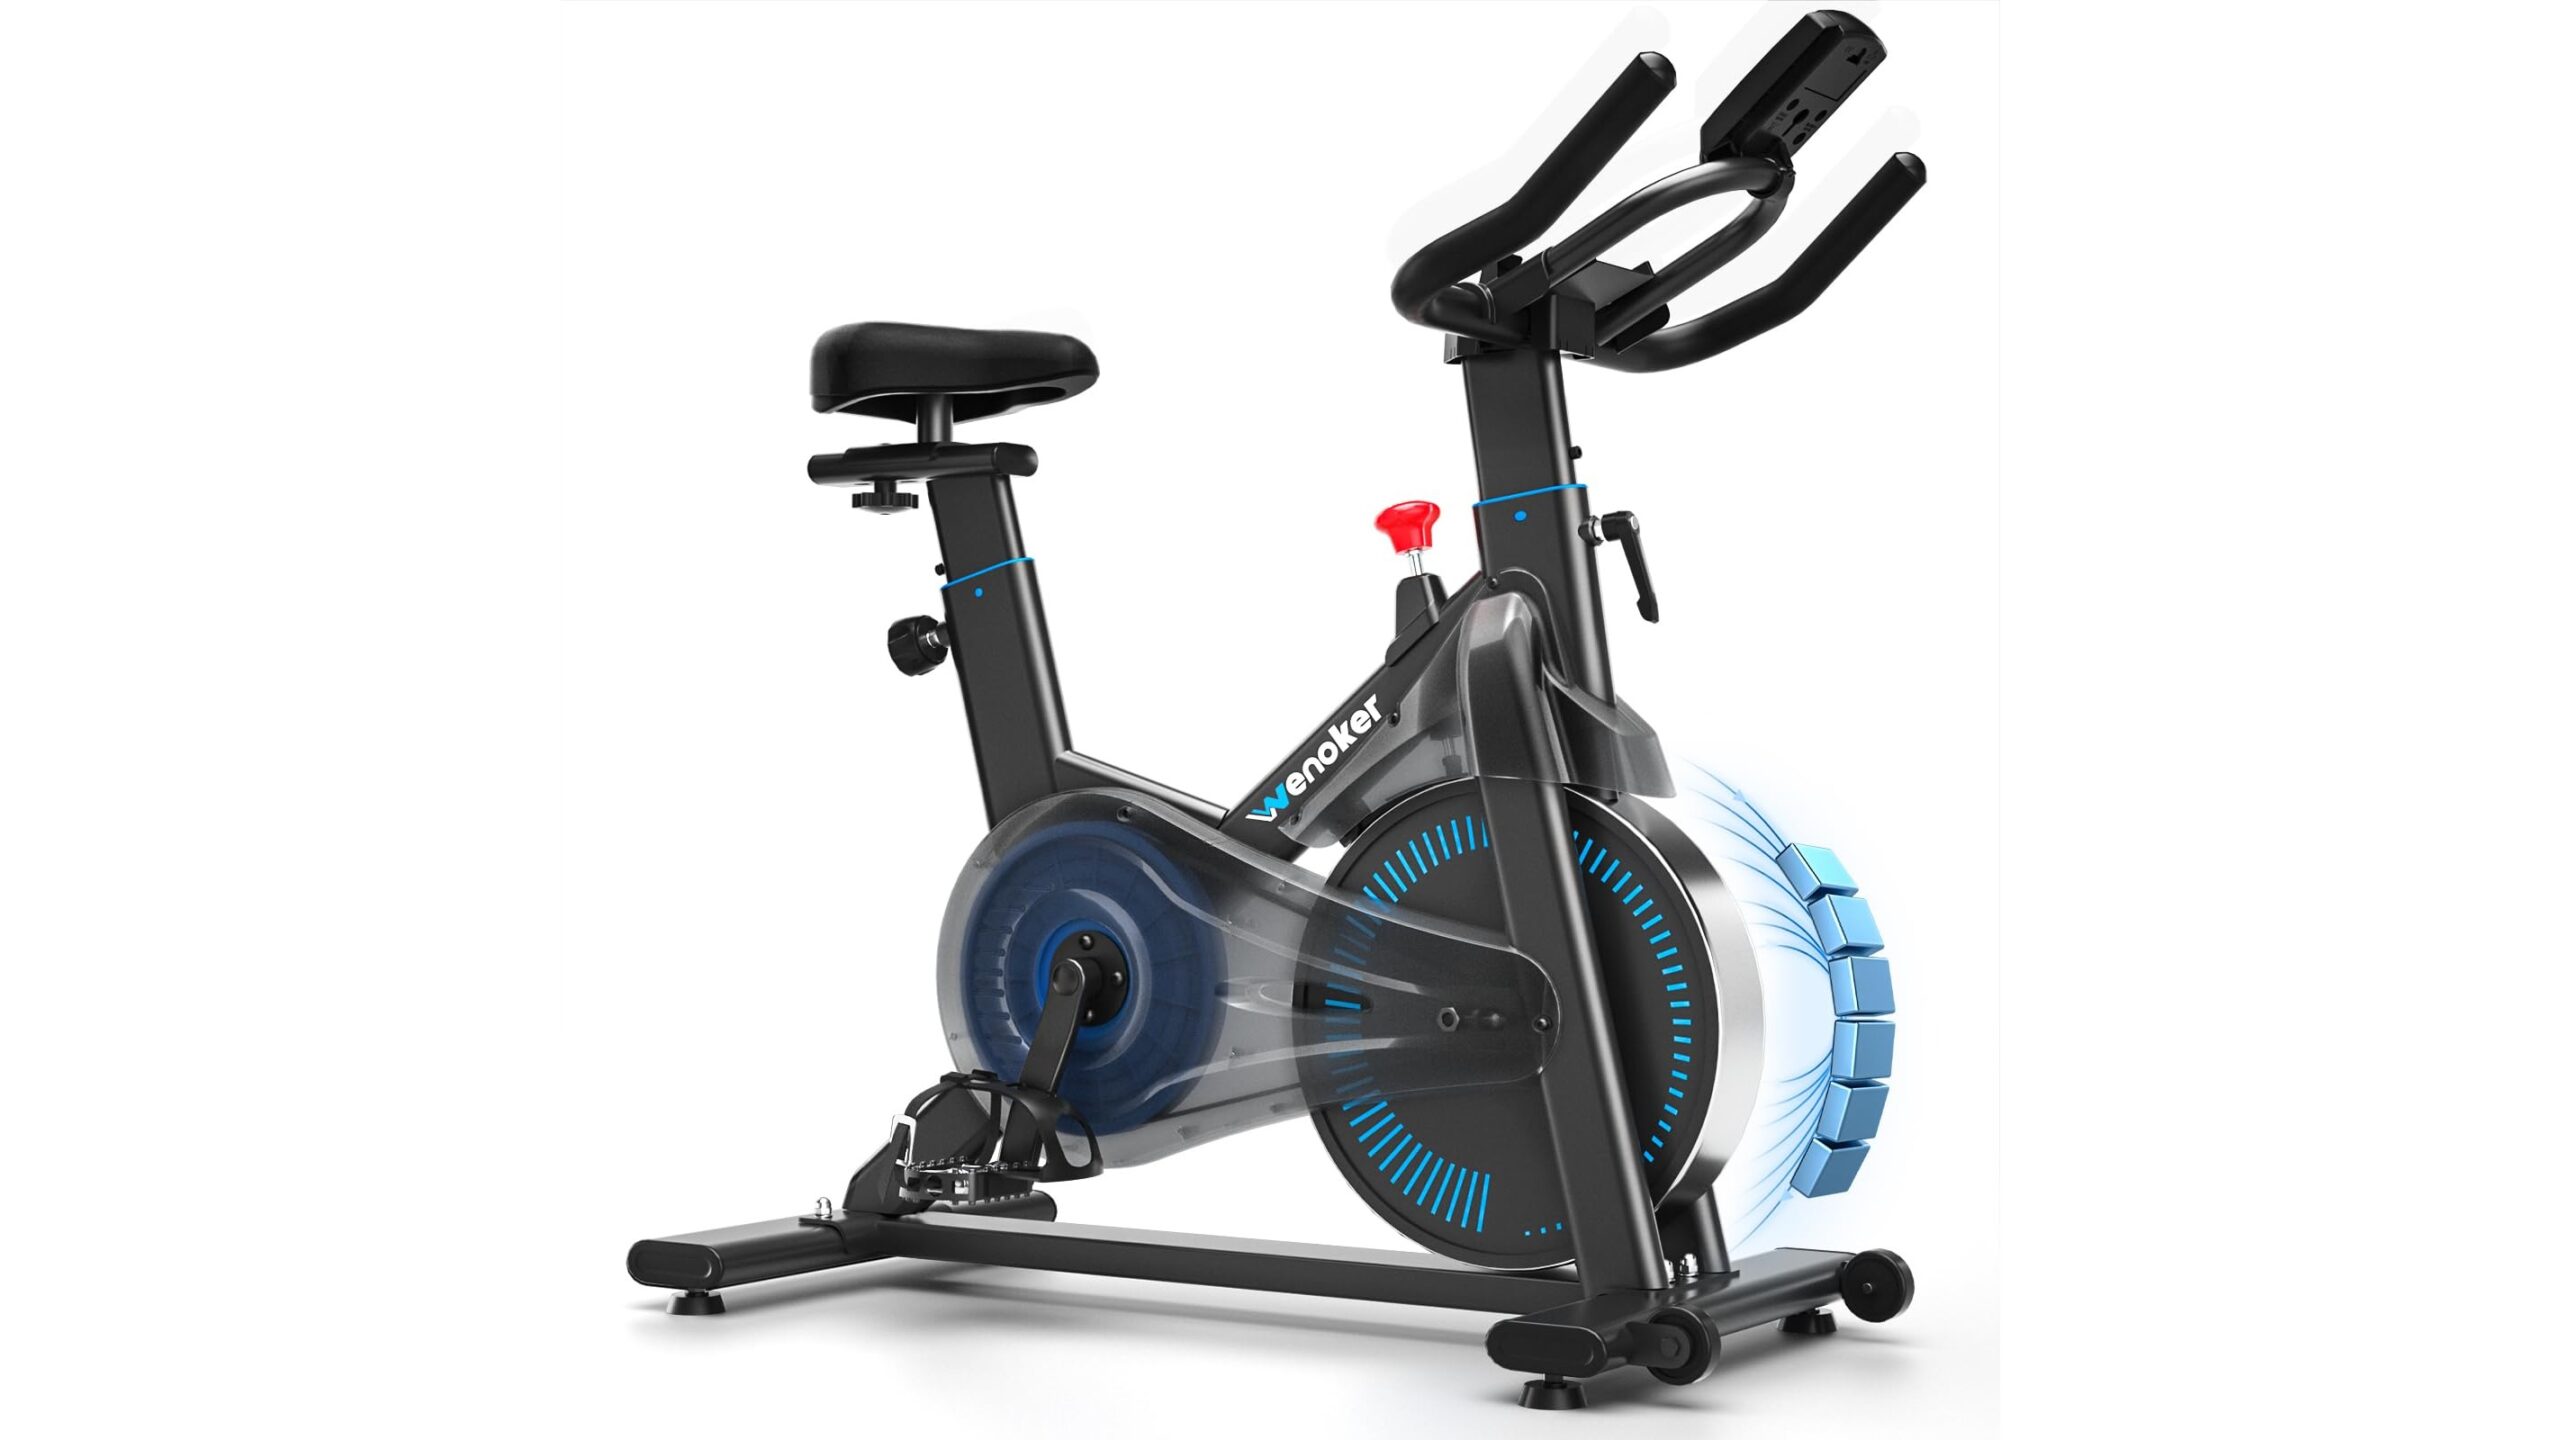
Once your basic home gym dashboard is working, you can gradually expand it. Add a panel for bodyweight tracking, pulling from a smart scale export, or integrate step counts and daily activity from an open API. If you are comfortable with home automation, you can even log garage temperature, lighting status, or equipment usage. Because everything runs on open‑source tools, you can move between devices, change databases, or upgrade hardware without losing your history. The combination of Grafana and a spare laptop essentially becomes a flexible fitness hub where you decide what matters, from power output on the bike to weekly squat volume.
By turning an unused laptop into a home gym dashboard powered by Grafana and other open‑source tools, you create a powerful, custom training cockpit without subscriptions. Centralising heart rate, workout logs and timers on one screen helps you make better decisions mid‑session and over the long term. The setup is modular, affordable, and fully under your control, making it an ideal project for anyone serious about optimising their home training environment.